Showing posts with label market. Show all posts

Thursday, May 31, 2012

Be Wary of Polling Now

Be wary of polling in this environment. "In our NBC-Marist poll of Florida, Romney leads with landline respondents, 48%-45%. But Obama leads among cell phone respondents, 57%-34%. And in Virginia, Romney’s up one among landline folks, 47%-46%, while Obama is up 54%-36% with cell users." http://firstread.msnbc.msn.com/_news/2012/05/24/11859035-first-thoughts-mr-48

And this is just one variable. In addition, there's an overall issue with statistical polling in this environment. It's based on a model that assumes that there are no connections between those being polled. With the Internet and the 24 hr, 7 day cable news, the population is too volatile. And, it doesn't account for emergent behavior.

Thursday, September 9, 2010

Often Wrong, But Never in Doubt

Richard Thaler, New York Times, 8/22/10

"Businesses in nearly every industry were caught off guard by the Great Recession. Few leaders in business — or government, for that matter — seem to have even considered the possibility that an economic downturn of this magnitude could happen.

What was wrong with their thinking? These decision-makers may have been betrayed by a flaw that has been documented in hundreds of studies: overconfidence.

Most of us think that we are “better than average” in most things. We are also “miscalibrated,” meaning that our sense of the probability of events doesn’t line up with reality. When we say we are sure about a certain fact, for example, we may well be right only half the time."

This is a really interesting article about how bad we are at forecasting the future.

"...chief financial officers of major American corporations are not very good at forecasting the future. The authors’ investigation used a quarterly survey of C.F.O.’s that Duke has been running since 2001. Among other things, the C.F.O.’s were asked about their expectations for the return of the Standard & Poor’s 500-stock index for the next year — both their best guess and their 80 percent confidence limit. This means that in the example above, there would be a 10 percent chance that the return would be higher than the upper bound, and a 10 percent chance that it would be less than the lower one.

It turns out that C.F.O.’s, as a group, display terrible calibration. The actual market return over the next year fell between their 80 percent confidence limits only a third of the time, so these executives weren’t particularly good at forecasting the stock market. In fact, their predictions were negatively correlated with actual returns. For example, in the survey conducted on Feb. 26, 2009, the C.F.O.’s made their most pessimistic predictions, expecting a market return of just 2.0 percent, with a lower bound of minus 10.2 percent. In fact, the market soared 42.6 percent over the next year."

One of the interesting omissions of this article is that it never mentions the complexity of the future. It blames the failures on "mis-calibration" and "hubris".

Read the Article

Friday, January 16, 2009

A Market Intelligence System

A conceptual description of a market intelligence system based on web 2.0 technologies for a collaborative team.

Market Intelligence System
View SlideShare presentation or Upload your own. (tags: market intelligence)

Thursday, January 15, 2009

Technological Substitution In Market/Marketing Research

Substitution analysis is a well accepted method of technological forecasting in use for 36 years. In these analyses, the Fisher-Pry model was used. The Fisher-Pry model predicts characteristics loosely analogous to those of biological system growth. It results in an S-curve (more formally, sigmoidal curve) familiar to many because the curve is in the shape of an S. These natural growth processes share the properties of relatively slow early change, followed by steep growth, then a turnover as size asymptotically approaches a limit. The relationship between the fraction of total market taken by the new technology, f, is often given as:

f = 1 /(1 + c exp(-bt))

where t is time, and c and b are empirically determined coefficients.

Read report

Types of Market Research and a Research Taxonomy

There are four distinctly different types of market research. Each has it's own objectives and some have unique methods. In looking at the total research industry and it's future, the standard perspective of quantitative and qualitative doesn't really help very much. The view must be from the user's perspective and be related to the purpose, not the method.


Also, a new taxonomy for research tools and technologies is needed. With many new technologies being devloped, a broader perspective is needed. I propose one based on two dimensions - medium and methods.

Creativity and Market Research

Creativity is another application for research. The creative process is usually shown in four steps:

1. Saturation
2. Incubation
3. Ideation
4. Evaluation

In the saturation stage, an individual or a group is given a lot of information about the subject or problem. Research techniques provide this information.

In the incubation stage individuals are left alone to think about the problem or subject. For groups, they can both think about the problem or subject and talk about it with each other. The social technologies can be used for this.

In the ideation stage the individual or group are encouraged to suggest as many ideas as possible within a time frame. For groups, it is expected that the ideas will build on each other. A ‘focus group” type of environment is often used.

In the evaluations stage, there are usually three subtasks – explanation and expansion of the ideas, establishing criteria for evaluation and evaluation. Surveys are most often used for this stage, but the newer predictive market approaches show some promise.

Wednesday, January 7, 2009

The Evolution of Market, Marketing and Customer Research

According to IDC, the digital universe in 2007 was 2.25 x 10^21 bits (281 exabytes or 281 billion gigabytes). By 2011, the digital universe will be 10 times the size it was in 2006. The enterprise share of the digital universe is widely skewed by industry, having little relationship to GDP or IT spending. The finance industry, for instance, accounts for almost 20% of worldwide IT spending but only 6% of the digital universe. Meanwhile, media, entertainment, and communications industries will account for 10 times their share of the digital universe in 2011 as their share of worldwide gross economic output.

One area driving this exponential growth of information is content creation. Content is increasing created originally in digital format. In addition we are rapidly converting analog content into digital information. Moreover, a phenomena called “mashup” is becoming widespread. Wikipedia defines a digital mashup as “a digital media file containing any or all of text, graphics, audio, video, and animation, which recombines and modifies existing digital works to create a derivative work.” This has always been going on in a wide range of fields from science to art, but in digital form, it is exploding, creating even more digital information.

Tidwit describes digital content as “quite simply any form of data or information in digital form (i.e. an electronic file) rather than physical form. Examples of digital content can be anything from a simple poem to photos, graphic art, research papers, articles, reports, statistical databases, business plans, engineering designs, e-books, multimedia (music and movies), etc. In other words, digital content is any type of content that happens to be in bits and bytes.” And, in my diagram below, content include the development of platforms, environments and other tools that enable users to create more content.

Content is created by an enterprise. The enterprise can be an individual or a multinational corporation. In the past, the enterprise created content and interacted with the content in order to improve it. The content was developed for a medium, when completed it was published. It was then distributed and delivered via a device to multiple people. In order to determine the number of potential users, user needs for the content or how best to market it, market or marketing research was conducted. Or, if you wished to know how the content was being used, what people thought about it, or what improvements were needed, customer research was performed. However, that research was conducted outside the development - distribution system.

Today’s process is similar to the past except that now content is often created for multiple media and devices. For example, a song is performed for live audiences, recorded on a CD, performed in a DVD, and downloaded online as an mp3. For companies like Disney you can include movies, Broadway shows and then park rides. Devices range from movie theaters to telephones.

Yesterday’s process was developed before digital media. Today’s process includes the capabilities of web 1.0. Yesterday’s and today’s process is enterprise centric. However, with the development of web 2.0, the process begins to shift from enterprise centric to content centric. (See Web 2.0 & Social Media for More information on web 1.0 & web 2.0 )

With web 2.0, the process of creating and distributing content can be much more interactive. Market, marketing and customer research is embedded in the process because the users can feedback information (actively or passively through sensors) at any part of the process and the enterprise can query, or collect data, at all stages of the process (with proper user knowledge and concurrence). However, the process is still enterprise centric.

In the future, as web 2.0 tools are developed and diffused, another significant shift occurs, as the process becomes content centric. Multiple enterprises and users collaborate through multiple devices and media to create content. This step short circuits the enter concept of market, marketing and customer research as users are partners, and integrated into the entire process.

The latter stages of the development of the process accelerates innovation by closing the loop between needs and implementation. It also fosters additional innovation as content becomes more easily “mashable”. Innovation diffusion accelerates.

This process is applicable to digital content where digital media and devices exist broadly. It is most applicable to incremental and distinct innovation. It is probably not useful for breakthrough innovation. At least in the past using the enterprise centric model, a lot of dat exists indicating that users can’t easily define the needs for breakthrough innovations. However, we have no data on the content centric process for breakthrough innovations. (See Innovate! for more information on incremental, distinctive and breakthough innovation. )

Saturday, November 1, 2008

It's your Move

A review of the past and present of market research, and a look into its future. The market research profession is undergoing disruptive innovation.

It\'s Your Move
View SlideShare presentation or Upload your own. (tags: market research)

Sunday, September 14, 2008

Complexity and the Market

In a previous post, I discussed the possibility that the market was complex, ie has the characteristics of complexity in a mathematical sense.

This morning I asked the question, "Tf the market is complex, then shouldn't the typical curve of complexity be the same for 2007 and 2008?" If the market is complex, and the form of that complexity has not changed in a year, then the answer would be yes. Even though the performance of the market is vastly different between the two years, and we've had the meltdown recently, the curves should look the same. To a first approximation, they do.

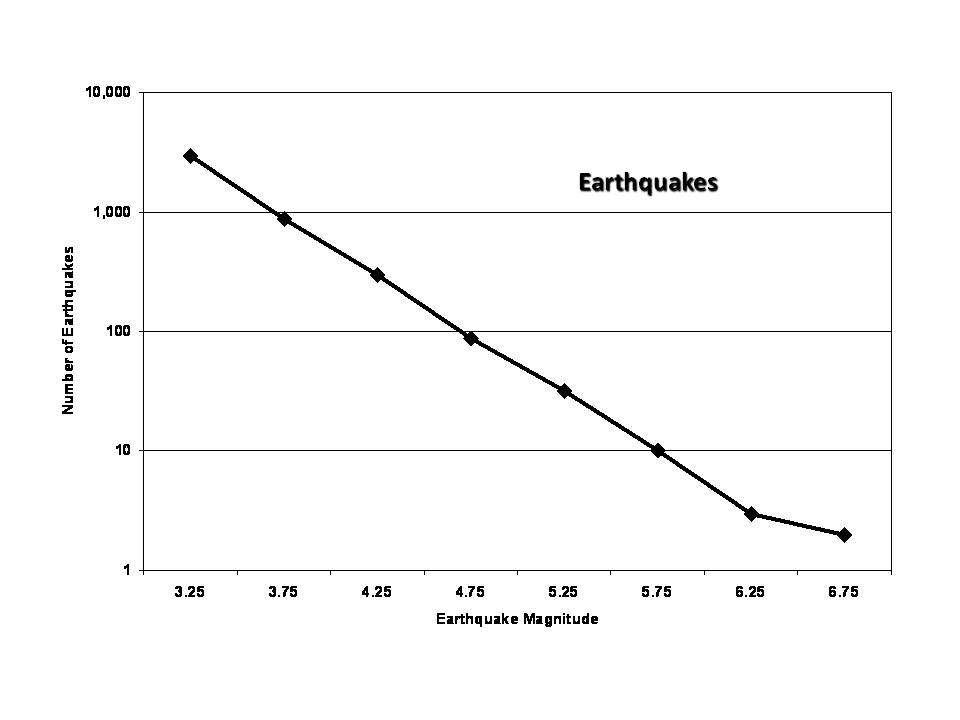
The curve I'm referring to is a graph of the frequency (or probability) of an event occurring as a function of the magnitude of that event. For many known complex systems, the equation for that relationship is P=C/(I^2). (Where ^ represents a superscript power.) Or in words, the probability of an event occurring is inversely proportion to the square of the intensity of the event.

The graph below is based on the data for the S&P 500 Index daily closing price for the years, 1990*, 2000, 2007 and 2008 to date. The absolute value of daily change was used for the calculations. Increments of $20 were used. So, the $20 on the graph means any change $0 and $20. While there is some variability among the data, I think that most can be explained by statistical differences as for the high magnitude events, there is no or at most one event per year.


Just for comparison, the graph below is for earthquakes in Southern California.(Ubiquity)


For the years 2007 and 2008, the probability was inversely proportional to magnitude of the day to day change to the 2.1 power with a correlation of 0.94 and 0.98.

What this, in a qualitative sense indicates, is that the market is complex, and therefore day to day change is unpredictable. It also indicates that while the changes in 2008 are terrifying, they fall on the same probability curve as those previous years sampled. It implies that the market is not in equilibrium and that cause and effect are not related. It does not imply anything about long term change.

* Note: To compare 1990 to the other years, the 1990 data were normalized to this time period.