
This morning I asked the question, "Tf the market is complex, then shouldn't the typical curve of complexity be the same for 2007 and 2008?" If the market is complex, and the form of that complexity has not changed in a year, then the answer would be yes. Even though the performance of the market is vastly different between the two years, and we've had the meltdown recently, the curves should look the same. To a first approximation, they do.
The curve I'm referring to is a graph of the frequency (or probability) of an event occurring as a function of the magnitude of that event. For many known complex systems, the equation for that relationship is P=C/(I^2). (Where ^ represents a superscript power.) Or in words, the probability of an event occurring is inversely proportion to the square of the intensity of the event.
The graph below is based on the data for the S&P 500 Index daily closing price for the years, 1990*, 2000, 2007 and 2008 to date. The absolute value of daily change was used for the calculations. Increments of $20 were used. So, the $20 on the graph means any change $0 and $20. While there is some variability among the data, I think that most can be explained by statistical differences as for the high magnitude events, there is no or at most one event per year.

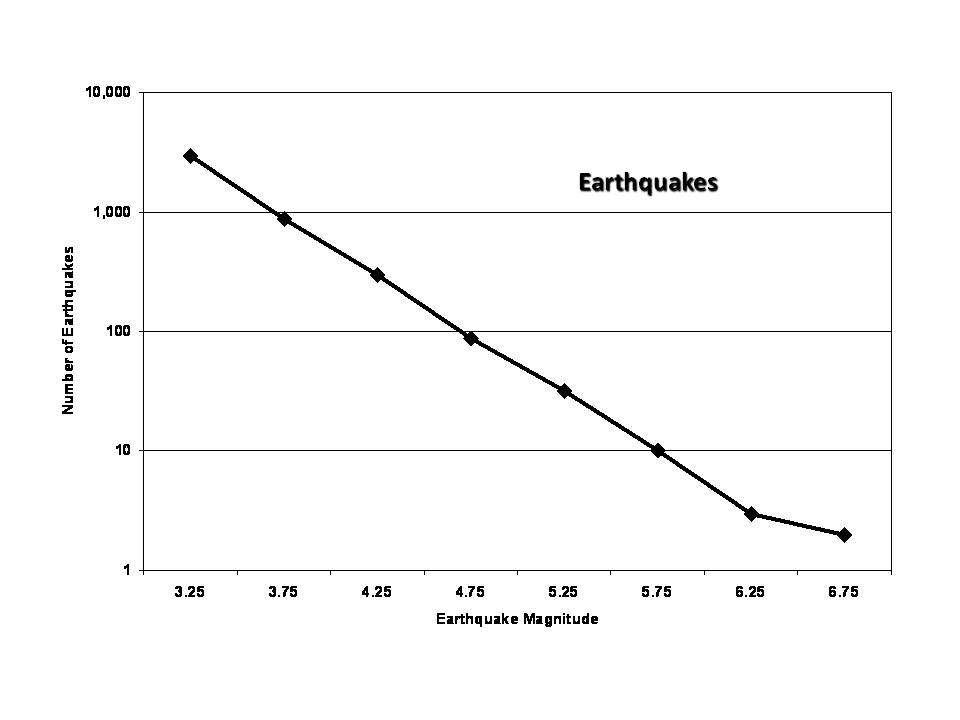
Just for comparison, the graph below is for earthquakes in Southern California.(Ubiquity)
For the years 2007 and 2008, the probability was inversely proportional to magnitude of the day to day change to the 2.1 power with a correlation of 0.94 and 0.98.
What this, in a qualitative sense indicates, is that the market is complex, and therefore day to day change is unpredictable. It also indicates that while the changes in 2008 are terrifying, they fall on the same probability curve as those previous years sampled. It implies that the market is not in equilibrium and that cause and effect are not related. It does not imply anything about long term change.
* Note: To compare 1990 to the other years, the 1990 data were normalized to this time period.
No comments:
Post a Comment